


This article provides information on the scheduled updates, the latest GDP per capita forecasts, and the most recently updated Sustainable Social Development Index (SSDI).
Early-to-mid-December: GDP forecasts;
(See Figures 1)
- Table 1. OECD-Eurostat ("Outlook")
- Table 2. Taiwan and Singapore
Sector accounts updates for year "Y-1"
- Table 1. "Sector"
completion of the SSDI for year "Y"
"Y" refers to the current year.
(See Figures 2–6.)
- Table 3. SSDI2025
§ Link: Sustainable Social Development Index
Dec 5, 2025
Apr 10, 2025
National Accounts Statistics
The purpose of this article is to compare all 36 advanced economies using key indicators from national accounts statistics. These indicators include:
In the updated 2023 MWI, Luxembourg ranks first, followed by the United States, Norway, Singapore, and Switzerland. Taiwan ranks 12th, overtaking Denmark compared to its 2022 position. (See Figure 6.)
Keywords: GDP per capita, PPPs, purchasing power parities, GNI, NNI, national income, household disposable income, compensation of employees, actual individual consumption, consumption expenditure per catpia, economic outlook, projections of GDP per capita
§ Links:
…… Sustainable Social Development Index
…… Household Mateiral Welfare and Income Distribution
…… Employee Material Welfare
…… Table 1. OECD-Eurostat
…… Table 2. Taiwan and Singapore
…… Table 3. Material Welfare Index
The corresponding figures for other economies in the Eurostat-OECD group, including Bulgaria, Romania, Hungary, and Poland, are shown in Table 1 and 3.
- Gross domestic product (GDP)
- Net national income (NNI)
- Household net-adjusted disposable income
- Compensation of employees
- Actual individual consumption (AIC)
- (2) NNI covers all resident sectors.
- (3) Household net-adjusted disposable income includes both households and non-profit institutions serving households (NPISHs).
- (4) Compensation of employees refers to the total remuneration—salaries, wages, and employers' social contributions—received by resident households.
In the updated 2023 MWI, Luxembourg ranks first, followed by the United States, Norway, Singapore, and Switzerland. Taiwan ranks 12th, overtaking Denmark compared to its 2022 position. (See Figure 6.)
New datasets have been incorporated since December 2, 2025, specifically the projections of GDP per capita (PPPs) for the period 2025–2027. The projections indicate that, in 2025, Ireland is expected to overtake Luxembourg, and Taiwan is expected to overtake the Netherlands and Iceland. In 2026, Taiwan is projected to exceed the United States, Denmark is projected to exceed Iceland, and Estonia is projected to exceed Japan. In 2027, Sweden is projected to exceed Australia, and Croatia is projected to approach Japan. (See Figure 1b and Table 1 and 2.)
Keywords: GDP per capita, PPPs, purchasing power parities, GNI, NNI, national income, household disposable income, compensation of employees, actual individual consumption, consumption expenditure per catpia, economic outlook, projections of GDP per capita
§ Links:
…… Sustainable Social Development Index
…… Household Mateiral Welfare and Income Distribution
…… Employee Material Welfare
…… Table 1. OECD-Eurostat
…… Table 2. Taiwan and Singapore
…… Table 3. Material Welfare Index
The corresponding figures for other economies in the Eurostat-OECD group, including Bulgaria, Romania, Hungary, and Poland, are shown in Table 1 and 3.
Apr 8, 2025
Employee Material Welfare
The purpose of this article is to provide an overview of Taiwan's average wages (or earnings) in comparison with advanced OECD economies, Singapore, and other European Union (EU) member states. Taiwan's government-published earnings and labor compensation surveys report a lower level of labor compensation than the figures found in national accounts statistics. Average wages estimated from national accounts also indicate significantly higher levels than those reported in the earnings survey. The OECD reports average annual wages derived from national accounts statistics. Therefore, in this article, Taiwan's average wages are sourced from national accounts rather than the earnings survey. It is important to note that the figures presented by either the OECD or this article may not fully align with the general public's experience.
In this analysis, employee material welfare is measured by net income, calculated from average annual wages (plus the corresponding in-work benefits) minus the corresponding income tax and social contributions, for non-elderly single-person households, and then adjusted for per-capita social transfers in kind (e.g., government spending on goods and services related to health, education, and other welfare programs for households). The cost of living is also taken into account. The results are quite astonishing—in 2023, Taiwan ranks among the top three countries in employee material welfare, even surpassing Switzerland, Norway, and the United States (see Figure 1).
Keywords: average annual wages, average annual earnings, net earnings, income tax, social contributions, price level index, individual consumption expenditure of general government, employee material welfare
§ Links:
…… Table 1. Raw data in 2023 and data sources (Last updated: Apr 8, 2025)
…… Table 2. OECD-Eurostat
…… Table 3. Taiwan and Singapore
…… The original artical in Mandarin
The corresponding figures for other economies in the Eurostat-OECD group, including Croatia, Cyprus, Malta, Bulgaria, Romania, Hungary, and Poland, are shown in Table 2. (Last updated: Nov 28, 2025)
Apr 7, 2025
Household Mateiral Welfare and Income Distribution
The aim of this article is to compare Taiwan with other advanced OECD economies in terms of household material welfare, representing the general living standards of individuals in Taiwan. Therefore, median income and income distribution are crucial indicators. The most recent household income survey data for most OECD countries refer to the year 2022. However, because Japan conducts such surveys only once every three years, the latest available data is from 2021. Thus, this article uses 2021 data for consistency. (Data for 2022 are also presented.)
The findings are surprising: Taiwan exhibits both a high level of material welfare and a low degree of income inequality. In addition, Taiwan shows some characteristics typical of the Continental European model, such as a low employment rate and a low poverty rate.
Keywords: median household disposable income, equivalised scale, Gini index, poverty rate, at-risk-of-poverty rate, household material welfare, European social models
§ Links:
…… Table 1. OECD-Eurostat
…… Table 2. Taiwan
…… The original artical in Mandarin
The corresponding figures for other economies in the Eurostat-OECD group, including Croatia, Bulgaria, Romania, Hungary, and Poland, are shown in Table 1. (Last updated: Jul 16, 2025)
Apr 2, 2025
Sustainable Social Development Index
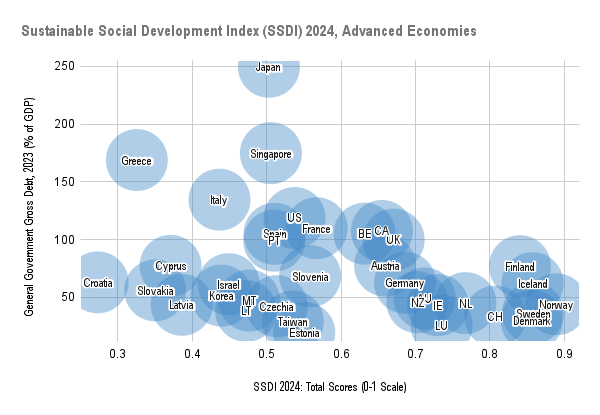
The Sustainable Social Development Index (SSDI) is composed of various economic and health statistics, as well as the results of key reports, designed to compare advanced economies based on material welfare (income and consumption), health, educational resources, human resources (employment and gender equality), democracy, freedom, competitiveness, natural environment, social environment (safety and security), and social values, including self-expression and life satisfaction. (See the indicies and raw data.)
Nordic countries rank at the top of this index, demonstrating the best functioning societies with sustainable government financing. This outcome suggests that certain characteristics of the Nordic model could serve as a model for advanced economies. (See Figure 1.)
Advanced economies are defined according to the International Monetary Fund (IMF) classification. For the purposes of this analysis, microstates—namely Andorra, Liechtenstein, Monaco, and San Marino—and the non-sovereign territories comprising Hong Kong, Macao, and Puerto Rico are excluded.
Keywords: sustainable development, living standard, material welfare, health indicators, public education expenditure, employment rate, gender equality indicators, Democracy Index, Freedom in the World, competitiveness report, environmental indicators, societal safety and security subdomain of the Global Peace Index, self-expression, World Happiness Report, life satisfaction, Nordic model
New! The Sustainable Social Development Index in 2025
In 2025, all Nordic countries continue to occupy the top positions in the SSDI ranking, with Norway ranking first, followed by Iceland. Scandinavian countries maintain high rankings and low levels of gross government debt as a share of GDP.
Mar 6, 2025
家庭可支配所得及所得分配之跨國比較
台灣家庭收支調查最新資料為2023年,OECD大多數國家的最新資料為2022年,日本為每三年調查一次,最新資料為2021年。在此選擇2021年的資料,比較OECD先進國家與台灣的家庭可支配所得中位數,再以PPP轉換,前五名國家依序為盧森堡、美國、挪威、瑞士、加拿大。台灣屬於所得較高且分配較均勻的國家,與北歐及荷比盧等國相當。按家庭可支配所得中位數計算家庭物質生活水平,前五名國家依序為盧森堡、挪威、加拿大、丹麥、美國;物質生活水平前十名國家,同時符合所得分配較均勻且貧窮率較低者,僅有挪威、丹麥、冰島、荷比盧、奧地利。
§ 資料表➀:OECD先進國家
§ 資料表➁:台灣
表一、OECD先進國家與台灣:2021年家庭可支配所得相關數據
表二、2021至2023年台灣的家庭所得分配
圖一、家庭收支調查 VS 國民所得統計
圖二、家庭所得:中位數 VS 吉尼係數
圖三、家庭所得:貧窮率 VS 吉尼係數
圖四、社會模式:就業率及貧窮率
Dec 30, 2024
2024年社會永續發展指數
本文為〈2014社會永續發展指數〉的更新版本,延用先前的架構,並將數據更新至目前最新資料。經過十年,即使調整部份項目,並加進新成為先進經濟體的三個國家,儘管如此,大部份國家的變動仍然相當小。值得一提,這次更新數據包含世界價值觀調查(WVS)第七回合及歐洲價值觀調查(EVS)第五回合的調查結果,並且完整比較各項指標之間的相關性。
經過這十年全球經濟及政治劇烈的變化,社會永續發展指數的變化相較之下並不大,同樣採用五個類別和11個主項目,評比36個已開發國家(新加入3國)。結果顯示,無論是綜合評比總分,還是排除自然環境評比,前五名都是北歐國家。綜合評比前三名依續為挪威、丹麥、冰島。相較於十年前,芬蘭的生活滿意度進步之大,位居第一,因此整體排名進入前五。前十名人口超過千萬的國家僅有瑞典、荷蘭、與澳洲。七大工業國當中,德國居首,超越加拿大。亞洲先進國家當中,台灣排名最高,超越日本。
經過這十年全球經濟及政治劇烈的變化,社會永續發展指數的變化相較之下並不大,同樣採用五個類別和11個主項目,評比36個已開發國家(新加入3國)。結果顯示,無論是綜合評比總分,還是排除自然環境評比,前五名都是北歐國家。綜合評比前三名依續為挪威、丹麥、冰島。相較於十年前,芬蘭的生活滿意度進步之大,位居第一,因此整體排名進入前五。前十名人口超過千萬的國家僅有瑞典、荷蘭、與澳洲。七大工業國當中,德國居首,超越加拿大。亞洲先進國家當中,台灣排名最高,超越日本。
資料表➀:SSDI 2024 table (2025/4/8更新1a.;2025/11/3調整權重)
資料表➁:Social values
〔圖片〕
圖一、總分 VS 美好生活
圖二、樂活指數 VS 生活水平
圖三、自然環境 VS 其餘指標
圖四、社會價值觀
圖五、自我展現指數
圖六、信任感與快樂感
圖七、社會包容力
〔表格〕
表一、2024年已開發國家社會永續發展指數摘要
表二、類別之間的相關係數
表三、類別與主項目之間的相關係數
表四、主項目之間的相關係數
表五、指標總表
Dec 28, 2024
物質生活水平指數:國民所得、家庭可支配所得、受僱人員報酬、及民間實際消費
台灣國民所得統計之所得收支帳,最新資料為2022年,指標如國民所得與家庭可支配所得,同時比較部門帳當中的常住戶之受僱人員報酬、及GDP支出面的民間實際消費,此四項數據皆除以年中人口數,再以PPP轉換。由這四項指標計算物質生活水平指數,採社會永續發展指數的計算方式得出加權平均數。結果顯示,在36個先進國家當中,前五名分別為美國、盧森堡、挪威、新加坡、及瑞士。
§ 資料表:MWI2022 (2025/4/8更新)
使用此份數據之文章:〈2024年社會永續發展指數〉
2025年以後的更新資料整理於下兩表
更新資料➀:OECD與歐盟先進國家
更新資料➁:台灣與新加坡
Dec 16, 2024
2023年各國員工平均薪資、物價、消費、及物質生活水平
依照2023年OECD最新統計的平均薪資數據,加進台灣及新加坡相對應的數據,範圍含蓋所有經濟活動,並非只有工商服務業,還包含農業及軍公教。平均薪資以全時約當量呈現,數值介於全時員工平均值和整體員工平均值之間。本文使用來自OECD、台灣主計處、及新加坡統計局的資料,比較33個先進國家的平均薪資水準,並透過OECD的稅捐模型計算領有平均薪資水準的民眾,以未婚無子青壯年的身份,扣除所得稅及社會安全捐而剩的淨所得,再列出各國物價水平,消費水準、及實物社會福利水準等數據比較。最後使用上述資料,比較各國員工的物質生活水平。
2023年瑞士幣值相當高,物價水平高居第一,薪資所得與淨所得,在匯率轉換下都位居第一。冰島物價水平僅次瑞士,薪資所得高居第四位。挪威幣值與日本雷同,較十年前相比大減,挪威與日本的物價水平皆低於美國,經匯率換算下的所得數值相對較低。總薪資所得經PPP轉換後,前三名分別是盧森堡、瑞士、及美國。新加坡與其他國家不同,數據僅計國民及永居身份者,並不含其他常住的外籍工作者,在此統計範圍之中,新加坡的薪資水平經PPP轉換後位居第四位。淨所得經PPP轉換後,前五名分別是新加坡、美國、瑞士、盧森堡、台灣。在員工物質生活水平方面,前五名分別是盧森堡、新加坡、瑞士、台灣、挪威。
2023年瑞士幣值相當高,物價水平高居第一,薪資所得與淨所得,在匯率轉換下都位居第一。冰島物價水平僅次瑞士,薪資所得高居第四位。挪威幣值與日本雷同,較十年前相比大減,挪威與日本的物價水平皆低於美國,經匯率換算下的所得數值相對較低。總薪資所得經PPP轉換後,前三名分別是盧森堡、瑞士、及美國。新加坡與其他國家不同,數據僅計國民及永居身份者,並不含其他常住的外籍工作者,在此統計範圍之中,新加坡的薪資水平經PPP轉換後位居第四位。淨所得經PPP轉換後,前五名分別是新加坡、美國、瑞士、盧森堡、台灣。在員工物質生活水平方面,前五名分別是盧森堡、新加坡、瑞士、台灣、挪威。
§ 資料表:EMW2023
2025年以後的更新資料整理於下兩表
更新資料➀:OECD與歐盟先進國家
更新資料➁:台灣與新加坡
Apr 24, 2016
各國歷年民間債務相對於GDP之規模
前陣子台港地區大肆報導中國潛在的債務危機,剛好讓Richard Vague所著之《下一回經濟災難》一書登上新聞。該作者曾在《The Atlantic》雜誌專欄發表有關他的著作內容。在專欄上〈政府債務並非問題,民間債務才是〉的一文中,該作者以日本銀行危機與美國次級房貸危機為例,說明當一國的民間債務餘額佔GDP的比例在150%以上,且五年來該比例成長至少18%時,債務危機就很有可能發生。今年《富比士》雜誌上的文章〈最容易陷入債務危機的七個國家〉,作者Steve Keen改而檢視民間債務增加量佔GDP的比例,列出2015年該比例在10%以上、且民間債務餘額佔GDP比例在175%以上的七個經濟體。在這七個經濟體當中,有五個是OECD先進國家,按債務增加量佔GDP的比例排序,依序是澳洲、瑞典、韓國、加拿大、與挪威。然而,根據國民經濟會計金融帳,最新的民間債務流量和餘額數據,相對於GDP之規模,明顯與該文有所抵觸。
§ 資料表:Private debt 2014 (於2016/4/23建立)
統計OECD先進國家與台灣歷年的民間債務流量及餘額,唯獨缺少紐西蘭的數據
表單「DebtT」與「DebtTC」列出流量
表單「Debt」與「DebtC」列出餘額
表單「DebtT%GDP」與「DebtTC%GDP」列出流量佔GDP之比例
表單「Debt%GDP」與「DebtC%GDP」列出餘額佔GDP之比例
表單名稱中的T係指流量、C係指合併後之資料
2016/4/26更新,2015年有資料的國家包括:澳洲、比利時、加拿大、芬蘭、希臘、挪威、瑞典、英國、美國
Subscribe to:
Comments (Atom)