


- Gross domestic product (GDP)
- Net national income (NNI)
- Household net-adjusted disposable income
- Compensation of employees
- Actual individual consumption (AIC)
- NNI covers all resident sectors.
- Household net-adjusted disposable income includes both households and non-profit institutions serving households (NPISHs).
- Compensation of employees refers to the total remuneration—salaries, wages, and employers' social contributions—received by resident households.
In the updated 2024 MWI, Luxembourg continues to rank first, followed by the United States, Norway, Singapore, and Switzerland. The Netherlands ranks sixth, overtaking Germany, while Taiwan moves ahead of Sweden compared with the 2023 ranking. (See Figure 6.)
Advanced economies are defined according to the International Monetary Fund (IMF) classification. For the purposes of this analysis, microstates—namely Andorra, Liechtenstein, and San Marino—and the non-sovereign territories comprising Hong Kong, Macau, and Puerto Rico are excluded.
Keywords: GDP per capita, PPPs, purchasing power parities, GNI, NNI, national income, household disposable income, compensation of employees, actual individual consumption, consumption expenditure per catpia, economic outlook, projections of GDP per capita
New datasets have been incorporated, specifically the projections of GDP per capita (PPPs). The projections indicate that, in 2026, New Zealand is expected to overtake Japan. In 2028, Sweden is projected to surpass Australia and Korea to surpass the United Kingdom. (See Figure 1b and Tables 1 and 2.)
§ Links:
…… Sustainable Social Development Index
…… Household Mateiral Welfare and Income Distribution
…… Employee Material Welfare
…… Table 1. OECD-Eurostat
…… Table 2. Taiwan and Singapore
…… Table 3. Material Welfare Index
…… Table 4. Other Economies
The corresponding figures for other economies in the Eurostat-OECD group, including Bulgaria, Romania, Hungary, and Poland, are shown in Tables 1 and 3. Figures for other economies outside the Eurostat-OECD group, such as Hong Kong, are shown in Tables 3 and 4.
Figure 1a.
- According to Eurostat Statistics Explained, GDP is equal to the sum of the gross value added of all resident institutional units engaged in production, plus any taxes on products, and minus any subsidies on products. Gross value added is defined as the difference between output and intermediate consumption. Alternatively, GDP can also be measured as the sum of final uses of goods and services (that is, all uses except intermediate consumption) at purchasers' prices, minus the value of imports of goods and services. It is also equal to the sum of primary incomes distributed by resident producer units.
- PPPs for GDP are used and sourced from the OECD (see Table 1). For Taiwan and Singapore, PPPs are estimated based on benchmark results from the International Comparison Program (ICP) 2021 (see Table 2).
- Data are generally sourced from the OECD and Eurostat. For Taiwan and Singapore, data come from their respective national statistics offices. (See Tables 1 and 2.)
- Figures for all countries refer to the calendar year.
- Limitations: Per-capita values for Luxembourg and Switzerland are distorted due to cross-border employment. Figures for tax havens—including Ireland, Luxembourg, Switzerland, and Singapore—are exaggerated.
- Figures are updated as of June 3, 2026.
It should be emphasized that the PPPs for GDP produced by the International Monetary Fund (IMF) differ significantly from those provided by Eurostat and the OECD for economies covered by the Eurostat–OECD PPP Programme. The IMF applies an extrapolation method based on implicit GDP deflators to update PPPs in non-benchmark years of the ICP. In contrast, Eurostat and the OECD employ what is widely regarded as the most robust extrapolation approach—the so-called "rolling survey (or benchmark) method"—which consists of six surveys conducted within a three-year cycle, combined with time-series price indices specific to each basic heading (the lowest level of aggregation).
For economies covered by the Eurostat–OECD PPP Programme, the World Bank adopts PPPs directly from Eurostat–OECD. For all other economies, however, the World Bank relies on PPPs derived through deflator-based extrapolation, as does the IMF.
As of late March each year, the OECD estimates PPPs for the preceding year for non-EU countries from those for the second preceding year using this approach, while incorporating provisional PPPs for the preceding year for EU countries from Eurostat. The OECD further updates PPPs and extends estimates to GDP expenditure components in June using more detailed extrapolation methods and in late December using the full set of price and expenditure data under the rolling survey approach. In addition, PPPs for the second and third preceding years are also revised in December.
Figure 1b.
- For OECD member countries, the figures for 2026 and 2027 are sourced from the OECD Economic Outlook, Volume 2026 Issue 1. For Cyprus and Malta, the figures for 2026 and 2027 are derived using projected real GDP growth rates from the European Commission Economic Forecasts and projected total population from the Annual Macro-Economic database of the European Commission (AMECO). Data are updated as of June 3, 2025.
- For OECD member countries, as well as Cyprus and Malta, the figures for 2028 are derived using nominal and real GDP growth rates and population growth projections from the IMF's World Economic Outlook (April 2026 edition).
- For Taiwan, the 2026 figure is based on the official forecast issued by its national statistical office, while the figures for 2027 and 2028 are derived from the IMF using a methodology consistent with that applied to OECD countries.
- For Singapore, the figures for 2026–2028 are derived from the IMF using a methodology consistent with that applied to OECD countries.
- The PPPs for Taiwan and Singapore are updated using the corresponding figures for the United States reported by the OECD.
- Figures for all countries refer to the calendar year, whereas the figures for New Zealand are based on the fiscal year starting on April 1.
- For projections covering the longer period from 2026 to 2031, see Figure 1a in the article "Schedule Updates."
- For Hong Kong's projected figures, see Table 4.
- Figures are updated as of June 3, 2026. (See Table 1 "Outlook.")
For OECD member countries and other economies in the Eurostat–OECD group, projected figures are updated semiannually (in June and December), primarily based on the OECD Economic Outlook and the AMECO database. In April each year, actual data for all advanced economies for the preceding year become available. During the periods from mid-April to early June and from mid-October to early December, projections for the current year and the subsequent one or two years are derived from the IMF's World Economic Outlook, based on nominal and real GDP growth rates and population growth projections.
For Taiwan, provisional data for the preceding year are released each February, leading to corresponding revisions of projections. For Singapore, actual data for the preceding year become available in February, and projections are revised on a comparable basis. Taiwan's official forecasts are issued quarterly, with projections revised accordingly. In addition, for both Taiwan and Singapore, projections are updated semiannually in June and December in line with the latest projections for the United States published by the OECD. They are also updated semiannually in April and October following the release of the IMF's World Economic Outlook. Specifically, Taiwan's projection for the second year ahead and Singapore's projections for the current year and one to two subsequent years are revised based on the updated forecasts. (Note: Taiwan's projection for the next year is based on the IMF's projection only in the absence of an official forecast. Between February and April, Singapore's projection for the current year is updated incorporating the official forecast for real GDP growth.)
Figure 2.
- NNI is calculated as Gross National Income (GNI) minus consumption of fixed capital. GNI—also referred to as the "gross" balance of primary income in the allocation of primary income account—represents the total income earned by residents of an economy. It is calculated as the sum of primary incomes already recorded in the Generation of Income Account that are receivable by resident institutional units (including gross operating surplus (GOS), mixed income, and compensation of employees), plus property income received, and minus property income paid. It is also equal to GDP minus primary income payable by resident units to non-resident units, plus primary income receivable from non-resident units to resident units.
- PPPs for GDP are used and sourced from the OECD (see Table 1). For Taiwan and Singapore, PPPs are estimated based on benchmark results from the International Comparison Program (ICP) 2021 (see Table 2).
- Data are generally sourced from the OECD and Eurostat. For Taiwan and Singapore, data come from their respective national statistics offices. (See Tables 1 and 2.)
- For Iceland, Norway, and New Zealand, data are sourced from their respective national statistics offices.
- Figures for all countries refer to the calendar year, whereas the figures for New Zealand are based on the fiscal year starting on April 1.
- Limitation: Figures for tax havens—including Ireland, Luxembourg, Switzerland, and Singapore—are exaggerated.
- Within the Eurostat-OECD group, other economies whose NNI figures are higher than that of Latvia include Poland, Romania, and Hungary.
- Figures are updated as of March 29, 2026.
Figure 3.
- Net-adjusted disposable income of households and NPISHs is calculated as their gross disposable income, minus their consumption of fixed capital, plus social transfers in kind from the government. Social transfers in kind from the government are equal to the individual consumption expenditure of the general government. Disposable income is the balancing item in the secondary distribution of income account, which includes current taxes on income and wealth, social contributions, social benefits other than social transfers in kind, and other current transfers. Adjusted disposable income is recorded in the redistribution of income in kind account.
- PPPs for AIC are used and sourced from the OECD (see Table 1). For Taiwan and Singapore, PPPs are estimated based on benchmark results from the International Comparison Program (ICP) 2021 (see Table 2).
- Data are generally sourced from the OECD and Eurostat. For Taiwan and Singapore, data come from their respective national statistics offices. (See Tables 1 and 2.)
- For Iceland, Norway, and New Zealand, data are sourced from their respective national statistics offices.
- Figures for all countries refer to the calendar year, whereas the figures for Australia and New Zealand are based on the fiscal year starting on July 1 and April 1, respectively.
- New Zealand: Data comprise the sum of net disposable income for households and NPISHs and the individual consumption expenditure of the general government (GICE). The former is based on the fiscal year and sourced from the national statistics office, while the latter is based on the calendar year and sourced from the OECD (due to a lack of fiscal year data).
- Singapore: Available source data comprise the gross disposable income of the personal sector and the individual consumption expenditure of the general government. (In Singapore, the personal sector refers to households and NPISHs.) CFC for the personal sector is estimated by multiplying total economy CFC by the ratio of gross operating surplus (GOS) for the personal sector to that of the total economy.
- Data for Israel is unavailable owing to the lack of a detailed breakdown of national disposable income for households and NPISHs.
- Limitation: Income distribution data are lacking, making this an imperfect metric for representing most residents. See the previously mentioned article for more on household income distribution. In 2021, Luxembourg and Norway ranked highest in median household disposable income adjusted for social transfers in kind.
- Within the Eurostat-OECD group, other economies whose figures are higher than that of Latvia include Poland, Hungary, and Romania.
- Figures are updated as of March 29, 2026.
Figure 4.
- According to Eurostat Statistics Explained, compensation of employees includes all forms of remuneration—both in cash and in kind—that employees receive from their employers in exchange for work performed. It comprises gross (pre-tax) wages and salaries, employers' actual social contributions, and imputed social contributions—those provided directly by employers to employees without the involvement of a social security fund, insurance enterprise, or autonomous pension fund. Compensation of employees received by resident households is recorded in the allocation of primary income account.
- PPPs for AIC are used and sourced from the OECD (see Table 1). For Taiwan and Singapore, PPPs are estimated based on benchmark results from the International Comparison Program (ICP) 2021 (see Table 2).
- Data are generally sourced from the OECD and Eurostat. For Taiwan and Singapore, data come from their respective national statistics offices. (See Tables 1 and 2.)
- For Iceland, Norway, and New Zealand, data are sourced from their respective national statistics offices.
- For Singapore, compensation of employees in the balance of payments statistics is not publicly available. As a result, the corresponding measure for resident households cannot be derived. Compensation of employees paid by resident units is used instead, resulting in an upward bias.
- Figures for all countries refer to the calendar year, whereas the figures for Australia and New Zealand are based on the fiscal year starting on July 1 and April 1, respectively.
- Limitation: This value is calculated by dividing the compensation of employees by the resident population rather than the number of resident employees. For total compensation per employee (inlcuding full-time equivalent units), see the Appendix Figure 1. For total wages and salaries per employee (including full-time equivalent units), see the Appendix Figure 2.
- Within the Eurostat-OECD group, other economies whose figures are higher than that of Greece include Hungary, Poland, Romania, and Bulgaria.
- Figures are updated as of March 29, 2026.
Figure 5.
- AIC refers to all goods and services actually consumed by households, consisting of consumer goods and services purchased directly by households, as well as services provided by NPISHs and the general government for individual consumption (such as health and education services).
- PPPs for AIC are used and sourced from the OECD (see Table 1). For Taiwan and Singapore, PPPs are estimated based on benchmark results from the International Comparison Program (ICP) 2021 (see Table 2).
- Data are generally sourced from the OECD and Eurostat. For Taiwan and Singapore, data come from their respective national statistics offices. (See Tables 1 and 2.)
- Unlike other OECD countries, data for New Zealand are sourced from different OECD data series and refer to the calendar year.
- Figures for all countries refer to the calendar year, whereas the figure for Australia is based on the fiscal year starting on July 1.
- Advantage: AIC per capita is a better metric to measure consumers' welfare than GDP per capita.
- Within the Eurostat-OECD group, other economies whose figures are higher than that of Latvia include Poland, Romania, and Hungary.
- Figures are updated as of June 3, 2026.
Figure 6.
- See the previously mentioned article for more on the material welfare index.
- For Dataset (3), Israel's figure is missing and was imputed using regression with Datasets (4) and (5) as explanatory variables (2024 result: 37,232; adjusted R² = 0.91).
- Within the Eurostat-OECD group, other economies whose figures in 2023 are higher than that of Greece include Poland, Hungary, and Romania. These figures are the weighted averages of four indicators, with the weights based on those of all 36 advanced economies.
- See Table 3 for more information.
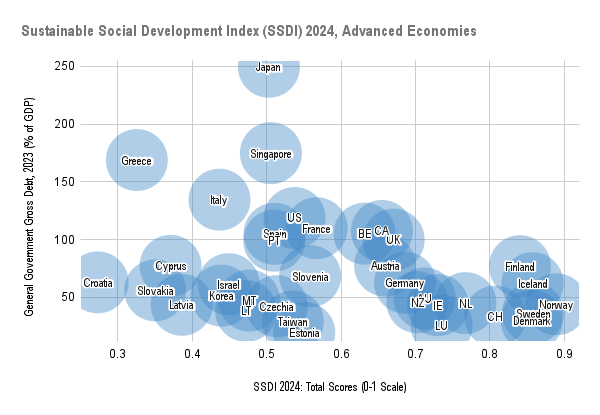
Despite having the second highest level of material welfare among advanced economies, the United States also records the highest Gini index and the second-highest poverty rate among advanced OECD economies, both based on equivalised disposable income. In the 2024 SSDI, the United States ranks second lowest in the health index and performs worst in the safety and security index among all advanced economies. These outcomes may be partly attributed to its high levels of income inequality and poverty.
Only 12 advanced economies meet the criteria of high material welfare (defined as an index score exceeding 0.6), low income inequality (a Gini index below 0.3), and a low poverty rate (below 10%). These include all Nordic countries, as well as the Netherlands, Luxembourg, Ireland, Austria, Belgium, France, and Taiwan—the only Asian country on the list. (For definitions of these income distribution indicators, see the article mentioned earlier.)
Appendix Figure 1.
- Per-employee figures refer to compensation of employees received by resident households, divided by the number of employees measured on a national concept basis. For Japan and the United States, employment is measured on a domestic concept basis.
- Per-employee figures on a full-time-equivalent (FTE) basis are calculated by multiplying the per-employee figures by the ratio of average usual weekly hours worked by full-time dependent employees in their main jobs to the average usual weekly hours worked by all dependent employees in their main jobs. Full-time employment is defined as usual working hours of 30 or more hours per week in the main job. The gap between the two datasets reflects the share of full-time-equivalent employees: the lower the share, the larger the gap. Consequently, per-employee values may be lower relative to the average compensation of full-time employees.
- For Japan, Korea, and Taiwan, working-hours data refer to total employed persons rather than employees. Working-hours data are sourced from the OECD, except that data for Canada, Taiwan, and Singapore are obtained from their respective national statistical offices.
- PPPs for AIC are used and sourced from the OECD (see Table 1). For Taiwan and Singapore, PPPs are estimated based on benchmark results from the International Comparison Program (ICP) 2021 (see Table 2).
- Data are generally sourced from the OECD and Eurostat. For Taiwan and Singapore, data come from their respective national statistical offices. (See Tables 1 and 2.)
- For Norway and New Zealand, compensation of employees data are obtained from their respective national statistical offices. For Iceland, compensation of employees data are obtained from the national statistical office, while employment data are sourced from the official labor force survey. For Japan and the United States, employment data are sourced from the OECD's Economic Outlook.
- For Singapore, compensation of employees in the balance of payments statistics is not publicly available. As a result, the corresponding measure for resident households cannot be derived. Compensation of employees paid by resident units is used instead, resulting in an upward bias.
- Data sources for New Zealand, Taiwan, and Singapore are described in the earlier article on average annual wages.
- Figures for all countries refer to the calendar year, whereas the figures for Australia and New Zealand are based on the fiscal year starting on July 1 and April 1, respectively.
Appendix Figure 2.
- Per-employee figures represent compensation of employees or wages and salaries, as recorded under the income approach to GDP (or the generation of income account), divided by the number of employees on a domestic concept basis. (See Table 1.)
- Per-employee figures on a full-time-equivalent (FTE) basis are calculated in the same manner as in Appendix Figure 1.
- For Japan, Korea, and Taiwan, working-hours data refer to total employed persons rather than employees. Working-hours data are sourced from the OECD, except that data for Canada, Taiwan, and Singapore are obtained from their respective national statistical offices.
- PPPs for household final consumption expenditure (or private consumption) are used and sourced from the OECD (see Table 1). For Taiwan and Singapore, PPPs are estimated based on benchmark results from the International Comparison Program (ICP) 2021 (see Table 2).
- Data sources for New Zealand, Taiwan, and Singapore are described in the earlier article on average annual wages.
- Data are generally sourced from the OECD and Eurostat. For Canada and Iceland, employment data are sourced from their respective official labor force surveys. For the United States, compensation of employees and wages and salaries are obtained from the Bureau of Economic Analysis (BEA), and employment data are sourced from the OECD's Economic Outlook. For Taiwan and Singapore, data come from their respective national statistical offices. (See Tables 1 and 2.)
- Figures for all countries refer to the calendar year, whereas the figures for New Zealand are based on the fiscal year starting on April 1.
Taiwan's official figure for compensation per employee in full-time equivalent unit for 2023, published in the statistical table "Measuring National Well-being," is substantially higher than the figure presented in Appendix Figure 2. The discrepancy (where the former exceeds the latter by approximately 9 percent) reflects differences in the choice of employment data. The official figure is calculated using original employment data from the labor force survey, excluding foreign workers and members of the armed forces. By contrast, the adjusted employment figure (including foreign workers and military personnel in active service) is approximately 9 percent higher than the original figure.
0 comments:
Post a Comment