


The results are surprising: Taiwan exhibits both a relatively high level of material welfare and a low degree of income inequality among advanced economines. In addition, Taiwan shows some characteristics typical of the Continental European model, such as a low employment rate and a low poverty rate.
Keywords: median household disposable income, equivalised scale, Gini index, poverty rate, at-risk-of-poverty rate, household material welfare, European social models
§ Links:
…… Table 1. OECD-Eurostat
…… Table 2. Taiwan and Singapore
The corresponding figures for other economies in the Eurostat-OECD group, including Croatia, Bulgaria, Romania, Hungary, and Poland, are shown in Table 1. (Last updated: Jul 16, 2025)
To account for the disproportionate relationship between household size and consumption needs, household income should be compared in terms of income per equivalised household unit—a method adopted by both the OECD and Eurostat, albeit in slightly different ways. The OECD uses the square root scale, while Eurostat applies the so-called "modified OECD scale." The square root scale calculates equivalised household size as the square root of the number of household members. The modified OECD scale assigns weights as follows: 1.0 for the first adult, 0.5 for the second and each subsequent person aged 14 or older, and 0.3 for each child under 14.
The Taiwanese government adopts the square root scale in its household income surveys, consistent with the approach used in New Zealand. Equivalised household income is ranked at the individual level, and the relative poverty threshold is defined as 50% or 60% of the median income. Although the Taiwanese government does not publish the exact median, it provides the mean income of the third quintile group for individuals, which serves as a close proxy for the median. The income groups for individuals are defined based on equivalised disposable income. Therefore, this article uses the third quintile group's mean income as a proxy for the median in Taiwan. However, the relative poverty threshold is based on the true median, which is not publicly disclosed.
Income figures reported by the OECD exclude imputed rents. By contrast, Taiwan's household income surveys include imputed rents from owner-occupied dwellings, calculated net of depreciation, as part of household income. To ensure comparability, Taiwan's income figures in this article are adjusted by applying the ratio of disposable income excluding imputed rents to total disposable income for households of sizes 3 and 4, based on equivalised measures. This adjustment reflects the fact that, at the individual level, the median household size is 3 and the mean household size is approximately 3.4–3.6 (see Table 2). Although the rent-to-income ratio is relatively low, the high homeownership rate implies that the Gini index for disposable income excluding imputed rents is still expected to increase significantly (see the discussion below for details).
Gini index = 2cov(Eₖ , k/N) / A
Individuals are ordered by equivalised disposable income in ascending order, from k = 1 to N, where N is the total number of individuals.
Eₖ denotes the equivalised disposable income of the household to which the k-th individual belongs, and A = Σ(Eₖ)/N represents the arithmetic mean of equivalised disposable income.
If all households' Eₖ are multiplied by a common adjustment factor R, both the numerator and the denominator (A) of the above Gini coefficient formula are scaled up by the same factor R, and thus the value of the Gini index remains unchanged.
In practice, higher-income individuals tend to reside in higher-priced housing, resulting in higher imputed rents (IRs). However, Taiwan's high homeownership rate (HOR) generates a substantial redistributive effect. Removing this effect would lead to a higher Gini index.
G(w/IR) = (1-S) ‧ G(w/oIR) + S ‧ C(IR)
G(w/oIR) = ( G(w/IR) - S ‧ C(IR) ) / (1-S)
where G(w/IR) denotes the Gini index of disposable income (DI) including IRs, and G(w/oIR) denotes the Gini index excluding IRs. C(IR) denotes the concentration coefficient of IRs, and S denotes the share of IRs in DI, including IRs.
When the HOR is very high, C(IR) is typically much smaller than G(w/oIR).
As C(IR) approaches zero, the ratio G(w/oIR)/GI(w/IR) approaches 1/(1-S).
In Taiwan's case for 2023, G(w/IR)=0.266, S=6.89%, and the upper-bound estimate of G(w/oIR) is approximately 0.286. Taiwan's HOR is 84.5%. In this case, the upper bound of C(IR) is 1-HOR = 0.155. Accordingly, the lower-bound estimate of G(w/oIR) is approximately 0.274. However, this calculation does not account for equivalisation. The reported value S=6.89% is based on pre-equivalised income. After equivalisation, the calculation of S and the definition of the HOR will be adjusted to the individual level, which would in turn change these values. Specifically, S is adjusted to approximately 6.62% and the HOR to approximately 86.9%. The estimated G(w/oIR) lies between 0.276 and 0.285. (For further details, see Table 2.) Population aging and declining fertility are leading to smaller and more homogeneous household sizes. As a result, adjustments to S and the HOR are expected to diminish over time.
Higher-income individuals also tend to belong to larger households, leading to higher in-kind social benefits. In-kind social benefits from Taiwan's social health insurance are defined, according to the OECD definition, as transfers from employment-related social insurance under the "current transfers received" category of household income. These benefits generally do not increase as rapidly as income at higher levels, thereby generating a redistributive effect.
Figure 1a and Figure 1b illustrate median household equivalised disposable income and the Gini index based on this measure. Income is converted to US dollars using current purchasing power parities (PPPs) for household final consumption expenditure (or private consumption). All data for countries in the Eurostat-OECD group are sourced from the OECD.
Figure 1a
Figure 1b
Because Australia and Iceland do not have data for 2022 and 2023 and Denmark, Germany, Korea, Norway, Switzerland, New Zealand, and Hungary for 2023, extrapolation is applied based on the assumption that changes follow the same pattern as those published by Eurostat or its national statistics office. Data for Japan in 2022 and 2023 and for Korea in 2023 are estimated using the same method, assuming that its change follows the same trend as mean household income divided by square root of mean household size in the middle-income quintile group. The Gini index for Australia and Iceland are also estimated using the same method. The Gini indices for Japan are from 2021, and Denmark, Germany, Norway, Switzerland, New Zealand, and Hungary from 2022. (See the raw data in Table 1 for more details.) Country code: See the Eurostat Website.
The household material welfare level is measured by the median household equivalised disposable income, adjusted for social transfers in kind from the government (which is equal to individual consumption expenditure by government and calculated here per person). This value is converted to US dollars using PPPs for actual individual consumption (AIC). To better account for extremely wealthy households—often excluded from household income surveys—the average household income is more accurately reflected in national accounts statistics. The figure used here is household net-adjusted disposable income per capita, converted to US dollars using the same PPPs as mentioned earlier. Household net-adjusted disposable income refers to the net disposable income of households and non-profit institutions serving households, adjusted for social transfers in kind from the government.
In 2022, Luxembourg and Norway rank highest in household material welfare levels. Australia, Austria, Belgium, Canada, Denmark, Iceland, Germany, the Netherlands, Sweden, and Switzerland also have higher levels than that of the United States. In terms of average income, the United States stands significantly above most of other advanced economies. Results for 2022 and 2023 are shown in Figures 2a and 2b, respectively.
Figure 2a
Figure 2b
See the explanatory notes accompanying Figure 1a and 1b. Country code: See the Eurostat Website.
See Appendix Table for figures including household material welfare (HMW, US=100), household net-adjusted disposable income per capita (HNADI, PPPs for AIC, US=100), the degree of deviation represented as standardized residuals (Deviation, linear trend, x=HMW, y=HNADI), and real median income growth rates (Growth, %, measured year-over-year, based on Tables 1 and 2). The real median income for Taiwan is not adjusted for imputed rents.
Figures for Taiwan:
In the Survey of Family Income and Expenditure (FIES), an income component titled "compensation of employees" includes primary job payroll (regular earnings), secondary job payroll (including regular earnings and pensions), and "other income" such as non-regular earnings. In the survey questionnaire, "other income" also appears to include employer contributions, which are excluded from the OECD definition of household income. However, in the English glossary of the survey, this component is not listed under the "other income" category.
Comparisons between (i) figures that include all employee income components in the FIES and (ii) total compensation structures reported in earnings-related surveys show notable discrepancies. Specifically, the share of "other income" in total employee income in the FIES is substantially lower than the combined share of non-regular earnings and employer contributions in total compensation reported in earnings surveys. In addition, the average per-employee total of these income components in the FIES is comparable to the average earnings reported in earnings surveys. One possible explanation is that employer contributions are either not recorded or only partially captured under the "other income" category.
Another issue relates to representativeness. Figures 2a and 2b both present adjusted median equivalised disposable income from the FIES alongside per-capita household net-adjusted disposable income from the national accounts. The discrepancy is particularly pronounced for Taiwan, despite its relatively low Gini index. This suggests that disposable income may be underestimated in the FIES.
Figures for Singapore:
The Singapore government uses both the square root scale and the modified OECD scale in its household income surveys, which include only households with citizen or permanent resident reference persons. However, household income is further redistributed through government in-kind transfers, which are not included in household income under the OECD definition when they are not employment-related. As a result, the Gini index is underestimated when the OECD definition is taken into account. For the calculation of equivalised disposable income, this article uses the mean income of the fifth and sixth decile groups as a proxy for the median. This value is divided by the square root of the groups' mean household size. Income groups are defined based on household income per household member. In this article, disposable income is defined as market income including Central Provident Fund (CPF) contributions from employment, less taxes and the CPF component of employment income, with the latter calculated using a contribution ratio of 37/117. (For more information, see Table 2.)
Gini index based on equivalised household income including CPF contributions from employment after accounting for taxes and government transfers including in-kind transfers:
- 2022 figure: 0.356
- 2023 figure: 0.351
Mean disposable income of the 5th and 6th decile groups, divided by the square root of the corresponding mean household size (USD, PPPs for private consumption):
- 2022 figure: 48,932
- 2023 figure: 52,026
The corresponding household material welfare (US=100):
- 2022 figure: 108.5
- 2023 figure: 108.1
Figure 3 presents both poverty rates and employment rates, highlighting the characteristics of different social models. The poverty rate reflects the proportion of people whose equivalised disposable income falls below the relative poverty threshold, which is set at 50% of the median household equivalised disposable income. The employment rate refers to the percentage of employed individuals aged 15 to 64 relative to the total comparable population (see SSDI 2024 for more details). In this analysis, a poverty rate exceeding 10% is considered high. An employment rate higher than that of the 15 pre-2004 European Union member states (70.5% in 2022) is also classified as high.
The poverty rate used by Eurostat is referred to as the at-risk-of-poverty rate. The key differences lie in the relative poverty threshold, which is set at 60% of the median income, as well as the use of a different equivalisation scale. This indicator is more suitable for comparing European countries and is traditionally used to analyze European welfare models. However, since this article compares advanced economies outside of Europe, OECD data is used instead. In addition, the Taiwanese government only publishes the poverty rate using a 50% of median income threshold and the square root equivalisation scale.
Figure 3
The poverty rate is calculated as the geometric mean of the rates for 2021 and 2022. For Iceland, the poverty rate is estimated using the same method as in Figure 1, assuming that its change follows the same trend as the at-risk-of-poerty rate, which defines the poverty threshold as 60% of the median disposable income. The poverty rate for Australia is from 2020 and for Japan from 2021. Country code: See the Eurostat Website.
The Nordic model is characterized by high employment rates and low poverty rates. In addition to the Nordic countries, nations with similar economic structures and material welfare levels include the Netherlands, Austria, and Ireland. However, only the Netherlands has comparable levels to the Nordic countries in terms of the per capita volume of social benefits in kind provided to households by the government. (See Table 1. Indicator: Individual consumption expenditure of general government per capita)
The Continental European model, on the other hand, is characterized by low employment rates and low poverty rates. France, Belgium, and Luxembourg are the only three european countries that meet these criteria. Interestingly, Taiwan, despite being an East Asian country, shares similar characteristics and material welfare levels. Japan and South Korea, however, follow entirely different patterns. Japan aligns with the Anglo-Saxon model, which features high employment rates and high poverty rates. In contrast, South Korea reflects the Mediterranean model, characterized by low employment rates and high poverty rates.
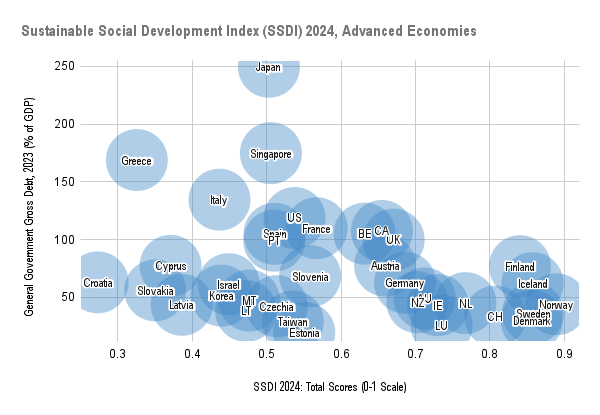
Taiwan's low employment rate is largely due to structural disadvantages for women in balancing work and childbirth, as well as early retirement practices—not due to a lack of labor market flexibility. Taiwan's low poverty rate, on the other hand, is partly the result of its progressive income tax system. Therefore, Taiwan's similarity to France and Belgium in terms of poverty and employment rates is more coincidental than structural. Nevertheless, policies aimed at improving women's rights in the labor market are steering Taiwan toward characteristics of the Nordic model. In 2024, Taiwan's employment rate increased to 70.3%, almost reaching the threshold of a high employment rate (71.3%) and closely approaching the European Union's 70.8%. Taiwan is an advanced economy with a relatively large government. Although government expenditure as a percentage of GDP is relatively low, the per-capita volume of social benefits in kind provided to households by the government is comparatively high, with universal healthcare accounting for a large proportion of this. (See Table 2 and Figure 4.) This indicates that universal welfare is a societal priority.
Figure 4
Country code: See the Eurostat Website.
0 comments:
Post a Comment