


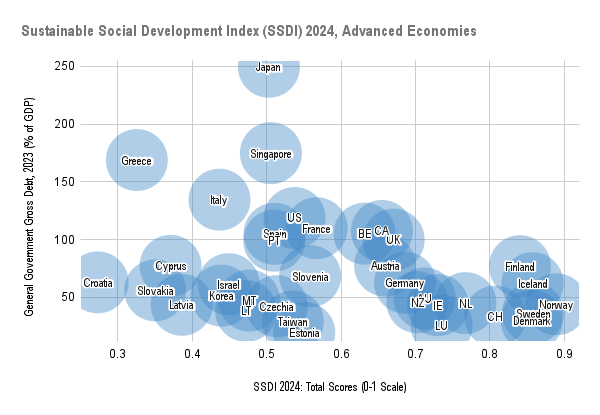


Nordic countries rank at the top of this index, demonstrating the best functioning societies with sustainable government financing. This outcome suggests that certain characteristics of the Nordic model could serve as a model for advanced economies. (See Figure 1.)
Advanced economies are defined according to the International Monetary Fund (IMF) classification. For the purposes of this analysis, microstates—namely Andorra, Liechtenstein, and San Marino—and the non-sovereign territories comprising Hong Kong, Macau, and Puerto Rico are excluded.
Keywords: sustainable development, living standard, material welfare, health indicators, public education expenditure, employment rate, gender equality indicators, Democracy Index, Freedom in the World, competitiveness report, environmental indicators, societal safety and security subdomain of the Global Peace Index, self-expression, World Happiness Report, life satisfaction, Nordic model
New! The Sustainable Social Development Index in 2025
In 2025, all Nordic countries continue to occupy the top positions in the SSDI ranking, with Norway ranking first, followed by Iceland. Scandinavian countries maintain high rankings and low levels of gross government debt as a share of GDP.
§ Contents:
…… Components
…… Material Welfare and Health
…… Education and Human Resources
…… Living Conditions, Democracy, and Social Values
…… Environment, Freedom, and Competitiveness
………… Figures
……………… Figure 1. Figure 2.
……………… Figure 3. Figure 4.
……………… Figure 5. Figure 6. Figure 7.
……………… Figure 8. Figure 9. Figure 10.
………… Tables
……………… Table 1. Table 2. Table 3. Appendix Table.
………… Links
……………… SSDI 2024 data (Last updated: Dec 10, 2025)
……………… Mateiral welfare raw data
……………… Health statistics
……………… Social values raw data
……………… Appendix Figure 1-1. Health Consumption and Performance
……………… Appendix Figure 1-2. Life Expectancy and Adult Mortality Rate of Males
……………… Appendix Figure 2-1. Gender Equality Index
……………… Appendix Figure 2-2. Gender Equality and Democracy
……………… Appendix Figure 3-1. Trust and happiness
……………… Appendix Figure 3-2. Social Tolerance
……………… Appendix Figure 3-3. Self-Expression Values
……………… Appendix Figure 3-4. Secular-Rational Values
……………… SSDI 2024 updated in time
……………… Mateiral Welfare Index updated in time
Figure 1.
The general government gross debt as a percentage of GDP is obtained from the IMF World Economic Outlook (Oct 2024). This government debt indicator is not included as part of the SSDI. Country code: See the Eurostat Website.
The updated SSDI table presents the corresponding figures for other economies in the Eurostat-OECD group, including Bulgaria, Romania, Hungary, and Poland. The weights assigned to each item and class are derived from those used for advanced economies. As shown in the table, Poland has a total score higher than Greece but lower than Slovakia. Romania scores higher than Croatia but lower than Greece. Hungary and Bulgaria score lower than Croatia. The table also reports the weighted average scores for country groups, with the European Union (0.531) recording a total score higher than that of the United States (0.523).
Components
The SSDI consists of five categories and eleven classes (or ten subcategories). The five categories are:
- Living conditions
- Democracy and freedom
- Competitiveness
- Environment
- Social values
Category 1 is further divided into four classes:
- (1a) Material welfare (income and consumption)
- (1b) Health
- (1c) Educational resources
- (1d) Human resocues (employment and gender equality)
- (2a) Democracy
- (2b) Freedom
Category 4 is divided into:
- (4a) Natural environment
- (4b) Social environment (safety and security)
- (5a) Rationality and self-expression
- (5b) Life satisfaction
The score calculation involves three steps:
- Normalization: Raw data within each class is normalized to a 0–1 scale, with the highest performance set to 1 and the lowest set to 0. Before normalization, income and consumption data are transformed non-linearly to account for diminishing marginal returns. Data related to the natural environment is treated similarly.
- Aggregation to class indices: The weight assigned to each dataset is determined by the inverse of its standard deviation (SD*), calculated after removing outliers. Specifically, the weight is proportional to 1/SD* and is further scaled by a ratio. (See Appendix Table.) The class indices is obtained after normalizing the weighted averages.
- Aggregation to higher levels: The same method is used to aggregate class indices into category scores, total socres, or scores at any higher level (e.g., combinations of selected classes or categories ), without normalization.
Figure 2.
Go back to the table of contents.
Material Welfare and Health
The Material Welfare Index (Class 1a) includes four indicators from national accounts statistics:
- Net national income (NNI) per capita
- Household net-adjusted disposable income per capita
- Compensation of employees per capita (as received by resident households in sector accounts)
- Actual individual consumption (AIC) per capita
It is important to note that material welfare levels do not account for income distribution indicators and only reflect average income and consumption levels. Average income may not be a reliable representation of the typical person in a country. Median income serves as a better metric; however, it cannot be used for comparison across all 36 advanced economies due to statistical challenges, such as missing data and discrepancies in definitions and methodologies. In fact, income inequality can have a negative impact on other indicators used in the SSDI, such as health statistics and indicators related to safety and security.
The Health Index (Class 1b) consists of two types of data:
- The volume indicator of health consumption – This refers to per-capita real expenditure of actual health consumption (US$, PPPs), sourced from the International Comparison Program (ICP) 2021.
- Health performance indicators, including:
- Life expectancy at birth
- Gender gap in life expectancy at birth
- Infant mortality rate
- Adult mortality rate for females
- Adult mortality rate for males
- Diabetes prevalence rate
Surprisingly, the aggregated values of health performance indicators do not correlate with health consumption volume. Economies such as the United States and the Czech Republic have high per-capita real expenditure of actual health consumption but score poorly in health performance (see Appendix Figure 1-1). Countries with higher price levels for health consumption—especially where labor costs are higher—tend to perform better in health. A moderate correlation exists between price level and health performance, but no such relationship is observed between consumption volume and performance (See the raw data for more details.) The United States is a notable outlier, as the only advanced economy without universal healthcare. It has significantly lower male life expectancy at birth and higher male adult mortality rate compared to other advanced economies. (Adult mortality rate refers to the probability of dying between ages 15 and 60.) (See Appendix Figure 1-2.)
Figure 3.
Country code: See the Eurostat Website.
Go back to the table of contents.
Education and Human Resources
The Educational Resources Index (Class 1c) includes:
- Per-capita real expenditure of actual education consumption (US$, PPPs) from the ICP 2021
- Government expenditure on education per capita (US$, PPPs)
- Government expenditure on education as a percentage of gross national income (GNI)
The Human Resources Index (Class 1d) focuses on employment and gender equality and includes:
- Employment rates (for individuals aged 15-64)
- Employment rates of females (for individuals aged 15-64)
- Gender gap in employment rates (divided by employment rates of both sexes)
The Class 1d index also incorporates data from the Global Gender Gap Report 2023 (World Economic Forum, WEF). (Data for Tawain are sourced from its Department of Gender Equality.) Subindices are used:
- Economic participation and opportunity
- Political empowerment
The Gender Equality Index in the economic and political domains is aggregated from the gender gap in employment rates and subindices from the report. The Gender Equality Index in the health domain is constructed by aggregating the gender gap in life expectancy at birth and the male-to-female ratio of adult mortality rates. Iceland and Norway rank highest in the former, while the Netherlands ranks highest in the latter (see Appendix Figure 2-1). After combining all indices across the three domains, Iceland and Norway continue to rank highest, followed by New Zealand and Sweden. Taiwan performs better than Singapore in the report subindex, but worse in the aggregated index for the health, economic, and political domains. Japan and South Korea rank the lowest in this aggregated index. A correlation coefficient of 0.65 is found between this index and the Democracy Index (Class 2a) (see Appendix Figure 2-2). Details of the Class 2a Index are provided later in the text.
Figure 4.
Country code: See the Eurostat Website.
Go back to the table of contents.
Livng Conditions, Democray, and Social Values
All Nordic countries rank within the top five for Category 1: Living Conditions. Additionally, the correlation coefficient between the Category 1 index and the Class 5b: Life Satisfaction index is 0.86 (see Figure 5). Raw data for life satisfaction (Class 5b) comes from Gallup and includes:
- Current life evaluation
- Freedom to make life choices
- Thriving in life
Key Findings from the SSDI
One of the most significant findings is the extremely high correlation (R = 0.94) between objective statistics and social values. (See Figure 6.) The objective statistics include five classes:
- (1a) Material welfare
- (1b) Health
- (1c) Educational resources
- (1d) Human resources
- (2a) Democracy
The social values index, which consists of self-expression and life satisfaction, is calculated using the same method. The raw data for self-expression values (a component of Class 5a, also referred to as survival/self-expression values) are derived from the World Values Survey (WVS) and the European Values Survey (EVS). The self-expression index reflects:
- The pursuit of self-expression and life quality
- Trust (See Appendix Figure 3-1.)
- Happiness
- Political engagement
- Tolerance for minorities (See Appendix Figure 3-2.)
Figure 5.
Figure 6.
For the latest updated version, see Figure 6 in this article. Country code: See the Eurostat Website.
Go back to the table of contents.
The Rationality and Self-Expression Index (Class 5a) is calculated as the arithmetic mean of traditional/secular-rational values and survival/self-expression values. These dimensions originate from the Inglehart-Welzel cultural map, with raw data from the WVS and the EVS. The values for these dimensions are computed as the arithmetic mean of all Z-scored items (both negative and positive poles) for the 36 developed countries. (See Figure 7 and the raw data.)
Over approximately a 10-year development period, self-expression values do not always increase for every nation. For example, Singapore achieved one of the highest levels of material welfare, yet its self-expression values declined. The top five developed countries with the most significant increases in self-expression values are Germany, Estonia, Taiwan, Lithuania, and Austria (see Appendix Figure 3-3 and the raw data). One reason for using secular-rational values in the SSDI is that some countries showed progress in this indicator over the development period, even if they did not show it in another. While secular-rational values are not correlated with some category or class indices, they still provide useful insights. (See Appendix Figure 3-4 and the raw data. Correlation data is presented in Tables 2 and 3.)
Figure 7.
Raw data are sourced from the 7th wave of the WVS and the 5th wave of the EVS. Exceptions include Belgium, Ireland, Israel, Luxembourg, and Malta, for which data are taken from the previous wave. To combine the results of surveys from different waves, the raw data is first normalized by the data for Sweden from the corresponding survey waves, before being converted into Z scores. Data for the UK refer specifically to Great Britain. Country code: See the Eurostat Website.
Go back to the table of contents.
Environment, Freedom, and Competitiveness
The Natural Environment Index (Class 4a) consists of three groups:
- Environmental health (PM2.5 exposure, unsafe drinking water)
- Air pollution (nitrogen oxides, sulfur dioxides)
- Climate change (CO₂ emissions per unit of GDP, renewable energy as a percentage of total electricity generation)
Figure 8.
Country code: See the Eurostat Website.
Go back to the table of contents.
The Social Environment Index (Class 4b) is based on the Societal Safety and Security Subindex from the Global Peace Index 2024 (Vision of Humanity) and the Law and Order Index from the Gallup Global Safety Report 2024. Data from both sources are standardized into Z-scores for the 36 advanced economies, with the former multiplied by –1 to align the direction of measurement. The Class 4b index score is calculated as the average of these standardized values. Luxembourg and Malta are excluded from the Global Peace Index 2024. The Freedom Index (Class 2b) is sourced from Freedom House and reflects political rights and civil liberties. The Democracy Index (Class 2a) also captures this dimension, using a different measurement approach but extending to a broader scope by focusing on the overall health of the democratic system. Singapore performs exceptionally well in Class 4b but ranks the lowest in Category 2 (Democracy and Freedom). By comparison, the United States ranks lowest in the Social Environment Index and also scores poorly in the Democracy and Freedom Index. Norway, Finland, Iceland, Denmark, and Switzerland demonstrate strong performance across both indices. (See Figure 9.)
Figure 9.
Country code: See the Eurostat Website.
Go back to the table of contents.
The Competitiveness Index (Category 3) is derived from either the World Competitiveness Ranking 2024 (International Institute for Management Development, IMD) or the Global Talent Competitiveness Index 2023 (WEF). The data are converted into Z-scores for the 36 advanced economies, and the higher of the two scores is used for each country. Malta is not included in the IMD report, while Taiwan is excluded from the WEF index. The correlation coefficient between the two indices is 0.90. Singapore ranks highest in competitiveness but lowest in democracy (see Figure 10). Taiwan and the Netherlands exhibit similar patterns, excelling in both competitiveness and democracy indices.
Figure 10.
Country code: See the Eurostat Website.
Go back to the table of contents.
Table 1. The Correlation Coefficient Between Categories
Note:
C1a–C2a refers to the weighted average of the first five class scores (from 1a to 2a).
C5b + Item 5a-2 refers to the weighted average of self-expression values and the class 5b index scores.
This table only show meaningful or significant results.
Testing for the significance of the Pearson correlation coefficient:
Null hypothesis (H0): R=0; Alternative hypothesis (Ha): R≠0
t value = R×SQRT((N-2)/(1-R2)); df = N-2; one-tailed; significance level (α) = 0.05
Go back to the table of contents.
Table 2. The Correlation Coefficient Between Categories and Classes
Note:
C1a–C2a refers to the weighted average of self-expression values and the class 5b index scores.
Item 5a-1 refers to the average of the traditional/secular-rational negative (N) and positive (P) pole values.
Item 5a-2 refers to the average of the survival/self-expression negative (N) and positive (P) pole values.
This table only show meaningful or significant results.
Testing for the significance of the Pearson correlation coefficient:
Null hypothesis (H0): R=0; Alternative hypothesis (Ha): R≠0
t value = R×SQRT((N-2)/(1-R2)); df = N-2; one-tailed; significance level (α) = 0.05
Go back to the table of contents.
Table 3. The Correlation Coefficient Between Classes
Note:
Item 5a-1 refers to the average of the traditional/secular-rational negative (N) and positive (P) pole values.
Item 5a-2 refers to the average of the survival/self-expression negative (N) and positive (P) pole values.
This table only show meaningful or significant results.
Testing for the significance of the Pearson correlation coefficient:
Null hypothesis (H0): R=0; Alternative hypothesis (Ha): R≠0
t value = R×SQRT((N-2)/(1-R2)); df = N-2; one-tailed; significance level (α) = 0.05
Go back to the table of contents.
| Category | Class | Item | Relative Importance |
| 1. Living Conditions | 1a. Mateiral Welfare | A. National Accounts -1. Net national income (NNI) per capita 2022 : (US$, PPPs for GDP) -2. Household net-adjusted disposable income per capita 2022 (PPPs for actual individual consumption, AIC) -3. Compensation of employees per capita (as received by resident households in sector accounts) 2022 : (US$, PPPs for AIC) -4. Actual individual consumption per capita 2022 : (US$, PPPs for AIC) | Class 1a = (1/4)/SD* Item A1 = 1/SD* : Item A2 = 1/SD* : Item A3 = 1/SD* : : : Item A4 = 1/SD* : |
| 1b. Health | A. National Accounts -5. Actual health consumption per capita 2021 :(US$, PPPs, ICP 2021 data) B. Health Statistics: Life and Death -1. Life expectancy at birth 2022 -2. Gender gap in life expectancy at birth 2022 : -divided by life expectancy at birth -3. Infant mortality rate 2022 -4a. Adult mortality rate, female 2021 or latest -4b. Adult mortality rate, male 2021 or latest C. Health Statitics: Chronic Disease -Diabetes Prevalance (aged 20-79) 2021 :(age-strandardised rates) |
Class 1b = (1/4)/SD* Item A5 = 1/SD* : : Item B1 = 1/SD* Item B2 = 1/SD* : Item B3 = 1/SD* Item B4a = (1/2)/SD* Item B4b = (1/2)/SD* : Item C = 1/SD* : | |
| 1c. Educational Resources | A. National Accounts -6. Actual education consumption per capita 2021 :(US$, PPPs, ICP 2021 data) D. Education Statistics Government education expenditure 2021 -1. Expenditure per capita :(PPPs for actual education 2021) -2. Expenditure, % of GNI | Class 1c = (1/4)/SD* Item A6 = 1/SD* : : : Item D1 = 1/SD* : Item D2 = 1/SD* | |
| 1d. Human Resources | E. Employment Statistics -1. Employment rate (aged 15-64) 2022 -2. Employment rate, female (aged 15-64) 2022 -3. Ratio of gender gap in the employment rate to the employment rate of both sexes (aged 15-64) 2022 F. Gender Equality Report WEF: Gender Gap Index 2023 National Statitics of Tawian: Gender Statistics -Economy participation and opportunity; political empowerment | Class 1d = (1/4)/SD* Item E1 = (1/2)/SD* Item E2 = (1/4)/SD* Item E3 = (1/4)/SD* : : : : : Item F = 1/SD* | |
| 2. Demoracy and Freedom | 2a. Democracy | EIU: Democracy Index 2023 (60 indicators) | Class 2a = (1/2)/SD* |
| 2b. Freedom | Freedom House: Freedom in the World 2024 (25 indicators) | Class 2b = (1/2)/SD* | |
| 3. Competi-tiveness | 3-. Competi-tiveness | G. Competitiveness Report IMD: World Competitiveness Ranking 2024 WEF: The Global Talent Competitiveness Index 2023 | Class 3 = 1/SD* |
| 4. Environ-ment | 4a. Natural Environment | H. Environment Report and Statistics Group 1. Environmental Health Yale University: Environmental Performance Index 2024 -1a. PM2.5 exposure [HPE] 2022 -1b. Unsafe water drinking [UWD] 2021 Group 2. Air pollution Yale University: Environmental Performance Index 2024 -2a. Nitrogen oxides exposure [NOE] 2022 -2b. Sulfur dioxides exposure [SOE] 2022 Goupr 3. Climate Change -3a. CO2 emissions, % of GDP(2021 US$, PPP) 2022 -3b. Electricity production from renewable energy, % of total electricity production 2022 |
Class 4a = (1/2)/SD* : : : Item H1a = 1/SD* Item H1b = 1/SD* : : : Item H2a = (1/2)/SD* Item H2b = (1/2)/SD* : Item H3a = (1/2)/SD* Item H3b = (1/2)/SD* : |
| 4b. Social Environment | I. Saftey and Security Report Vision of Humanity: Global Peace Index 2024 -Societal Safety and Security (subindex) Gallup Global Safety Report 2024 -Law and Order Index (scores for 2023) | Class 4b = (1/2)/SD* | |
| 5. Social Values | 5a. Rationality and Self-Expression | World Values Survey and European Values Surveys Raw data used for the Inglehart-Welzel culttural map: -Traditional / Secular-rational dimension -Survival / Self-expression dimension | Class 5a = (1/2)/SD* |
| 5b. Life Satisfcation | J. Life Satisfaction Report Gallup: World Happiness Report 2024 -Current life evaluation (Life today) 2022 -Freedom to make life choices 2022 Gallup: State of the Global Workplace 2024> -Thriving (%), average for 2021-2023 | Class 5b = (1/2)/SD* : Item J1 = 1/SD* Item J2 = 1/SD* : Item J3 = 1/SD* | |
| § Data Sources: A1-4: See the raw data. B: World Databank, World Bank > World Development Indicators (WDI) --Data for Taiwan is sourced from the Ministry of the Interior, Taiwan. C: World Databank, World Bank > World Development Indicators (WDI) --Data for Taiwan: IDF Diabetes Atlas 2021 D: World Databank, World Bank > World Development Indicators (WDI) --Data for Taiwan: the Ministry of Education Taiwan. E: OECD, Eurostat, National Statistics of Taiwan, and Singapore Statistics H3a: World Databank, World Bank > World Development Indicators (WDI) --Data for Taiwan: CO2 emissions and GDP from the National Statistics of Taiwan, PPP for GDP from ICP 2021 benchmark results H3b: OECD | |||
- The SD* is the standard deviation after removing outliers. To detect an outlier, the median absolute deviation (MAD) is used. A data point is identified as an outlier if the absolute value of its deviation from the dataset's median exceeds 2.24 times the MAD divided by 0.6745.
- Weights are assigned according to the relative importance of each item or class. Classes 1a–1d are each capped at 6.25%, Class 3 at 25%, and all other classes at 12.5%.
- All raw data for items A and H are converted into values before normalization using the following formula:
V = 1 - exp [ ln(1 - T)/S.D ]
Here, V is the value converted from D, which represents the raw data.
For each item A and D1 dataset, T is set to 0.95, and S is defined as the mean of the dataset plus its standard deviation.
For Item D2 dataset, T is set to 0.9, and S is defined as the mean of the dataset plus its standard deviation.
For each item H dataset, T is set to 0.9, and S is defined as the mean of the dataset plus twice its standard deviation. - For the Gender Equality Index, the weight assigned to each of the three domains is proportional to 1/SD*. Within each domain, the weights of individual indicators are likewise based on 1/SD*. An exception is made for the gender gap in employment rates, which is assigned a weight of (1/5)/SD*, reflecting the fact that the economic domain in the source report comprises five indicators.
0 comments:
Post a Comment