


Early-to-mid-December: GDP forecasts;
(See Figures 1)
- Table 1. OECD-Eurostat ("Outlook")
- Table 2. Taiwan and Singapore
Sector accounts updates for year "Y-1"
- Table 1. "Sector"
completion of the SSDI for year "Y"
"Y" refers to the current year.
(See Figures 2–6.)
- Table 3. SSDI2025
§ Link: Sustainable Social Development Index
Early-to-mid-January: GDP components and PPP updates;
- Table 1. "GDP" and Table 2. "TW" and "SG"
- Table 1. "PPP" and Table 2. "PPP_EXR_POP"
Sector accounts of Taiwan for year "Y-2"
- Table 2. "Income"
From late March to mid-April: GDP for year "Y-1"
GDP components and PPP updates
- Table 1. "GDP" and Table 2. "TW" and "SG"
Material Welfare Index for year "Y-2"
- Table 1. "Sector" and Table 2. "Income"
- Table 4. Material Welfare Index
§ Link: National Accounts Statistics
Mid-April (and late-October):
GDP forecasts
- Table 1. "Outlook" and Table 2. "Table"
Early-to-mid-June: GDP components and PPP updates, GDP forecasts
average annual wages for year "Y-1"
- Table 1. "AW" and Table 2. "Earnings"
§ Link: Employee Material Welfare
median household equivalised disposable income for year "Y-3"
- Table 1. "HIS" and Table 2. "Income"
§ Link: Household Mateiral Welfare and Income Distribution
From July to November: collection of key reports for SSDI
- Table 5. Key Reports
- Table 6. Natural Environment
World development indicators updates for health and education statistics
- Table 7. Health
- Table 8. Education
Labour force statistics updates
- Table 9. Employment and Gender Equality
From late November to early December: GDP components and PPP updates for Taiwan
GDP expenditure components updates for year "Y-1"
- Table 1. "GDP" and Table 2. "TW" and "SG"
National Accounts Statistics
Figure 1a illustrates the GDP per capita projections for countries with some of the highest levels—namely Norway, Switzerland, Taiwan, the United States, and the Netherlands—over the period 2026–2031. In 2025, Taiwan records one of the highest economic growth rates among advanced economies and overtakes the United States in terms of GDP per capita (PPP). Thereafter, the gap between Taiwan and the United States is projected to widen year by year (see Figure 1a).
Figure 1a.
- For further details on projections for 2026–2028, see Figure 1b in the article "National Accounts Statistics."
- The figures for 2029–2031 are derived using nominal and real GDP growth rates, as well as population growth projections, from the IMF's World Economic Outlook (April 2026 edition).
- Figures are updated as of July 22, 2026.
Figure 1b.
- For further details on the 2026 projection, see Figure 1b in the article "National Accounts Statistics."
- Figures for all countries refer to the calendar year, whereas the figures for New Zealand are based on the fiscal year starting on April 1.
- Figures are updated as of July 22, 2026. (See Table 1 "Outlook" and Table 2.)
Figure 1c.
- For further details on the 2026 projection, see Figure 1b in the article "National Accounts Statistics."
- Figures for all countries refer to the calendar year, whereas the figures for New Zealand are based on the fiscal year starting on April 1.
- Figures are updated as of July 22, 2026. (See Table 1 "Outlook" and Table 2.)
GDP per capita at PPP reflects the volume of final goods and services produced within a country on a per-capita basis. It is better interpreted as an indicator of output, net of intermediate consumption, rather than a precise measure of living standards. Figures for tax havens often convey a misleading impression of actual material welfare.
As shown in the analysis of household income distribution, Taiwan's Gini index of equivalised disposable income is comparable to those of Denmark and the Netherlands. Norway exhibits an even lower Gini index, whereas Switzerland records a substantially higher one. The United States has one of the highest levels among advanced economies. Interestingly, Taiwan ranks much lower in terms of median disposable income than in either household net-adjusted disposable income per person or GDP per capita (PPP). Because earnings constitute the vast majority of income for households in the middle-income group, a lower level of median disposable income likely reflects a lower level of median net earnings. As shown in the analysis of average annual wages, the net income of a worker earning the average wage in Taiwan ranks even higher than Taiwan's position in the GDP per capita (PPP) ranking. This suggests potential issues in the earnings distribution among workers in Taiwan.
Sustainable Social Development Index 2025
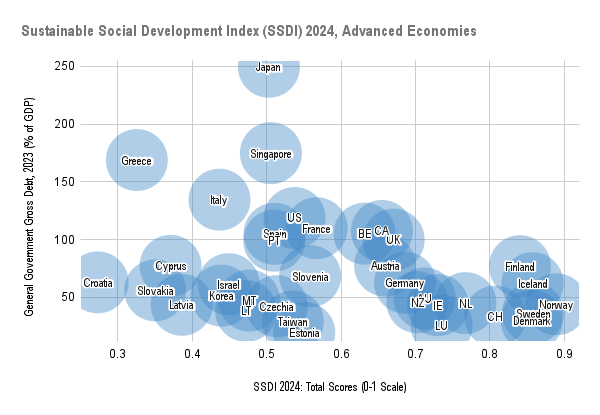
The Sustainable Social Development Index is compiled to compare advanced countries across a broader range of living-standard dimensions and state prosperity in the pursuit of sustainability. In 2025, all Nordic countries continue to occupy the top positions in the SSDI ranking, with Norway ranking first, followed by Iceland. Scandinavian countries maintain high rankings and low levels of gross government debt as a share of GDP (see Figure 2). The composition of total scores is shown in Figure 3.
Taiwan continues to exhibit the lowest performance in Class 4a: Natural Environment. When this class is excluded from the composite assessment, Norway retains its leading position, followed by Denmark and Iceland, and Taiwan's adjusted ranking rises above that of Slovenia, France, and Estonia (see Figure 4). Relative to their 2024 total scores, the countries exhibiting the most significant increases in 2025 include Iceland, New Zealand, Canada, Belgium, Lithuania, and Latvia, whereas Singapore and Israel experience notable declines (see Figure 5).
The correlation between objective statistics (living conditions and democracy) and social values (self-expression and life satisfaction) remains extremely high (0.94), nearly identical to the level reported in the 2024 edition (see Figure 6).
Figure 2.
The general government gross debt as a percentage of GDP is obtained from the IMF World Economic Outlook (Oct 2025). This government debt indicator is not included as part of the SSDI. Country code: See the Eurostat Website.
Figure 3.
- Almost all data have been updated, except for Class 5a and selected indicators under Class 4a (see Tables 3–9 and SSDI2024 Appendix Table).
- For class scores and items, see Table 3: SSDI2025.
- For Category 1, Items A1–A4 refer to 2023, Items A5–A6 to 2022 (based on 2022 PPPs), Items B1–B3 to 2023, Items B4a–B4b to 2022 or the latest available year, Items D1–D2 to 2022, and Items E1–E3 to 2023.
- For Class 4a, Items H3a–H3b refer to 2023.
- Key reports: WEF Gender Gap Index 2024, EIU Democracy Index 2024, Freedom House Freedom in the World 2025, IMD World Competitiveness Ranking 2025, WEF The Global Talent Competitiveness Index 2025, Vision of Humanity Global Peace Index 2025, Gallup Global Safety Report 2025, Gallup World Happiness Report 2024 (annual figures for 2023), Gallup State of the Global Workplace Report 2025
- Table 3 presents the corresponding figures for other economies within the Eurostat-OECD group, including Bulgaria, Romania, Hungary, and Poland. The table also reports the weighted average scores for country groups, with the European Union (0.541) recording a total score slightly below that of the United States (0.543).
Figure 4.
Country code: See the Eurostat Website.
Figure 5.
- See the previously mentioned article for more on the Sustainable Social Development Index.
- Within the Eurostat-OECD group, Poland records a higher score than Croatia and Greece in 2025.
Taiwan performs strongly in the areas of democracy, freedom, and competitiveness, but shows considerably weaker performance in health, educational resources, employment and gender equality, as well as the natural environment. These weaknesses result in relatively low scores in living conditions and environmental outcomes among advanced economies. Although Taiwan provides highly accessible and universal healthcare services, efforts to improve population health and reduce adult mortality remain insufficient. Similar to Japan, Taiwan places a heavy emphasis on family responsibility for education spending, which results in relatively low levels of government expenditure on education. This may signal an underlying issue in budget allocation for an aging society facing growing demands for elderly social security and healthcare, alongside persistently low fertility rates.
Taiwan often highlights its relatively high rankings in gender-equality-related indices among Asian economies. However, labour force statistics reveal a low female employment rate and a substantial gender employment gap. Health statistics likewise show large gender disparities in both life expectancy at birth and adult mortality rates. By contrast, Singapore performs better on these general gender-equality indicators. South Korea exhibits significantly lower levels of material welfare, employment rates, and gender equality compared with both Singapore and Taiwan, while performing relatively well in health and educational resources. Japan, meanwhile, ranks highest in health among these four Asian advanced economies but performs weakest in overall living conditions.
Figure 6.
Country code: See the Eurostat Website.
In the Gallup World Happiness Report 2024, Taiwan continues to rank highest among advanced Asian economies in the Asia-Pacific region in current life evaluation for 2023. Similarly, in the Gallup State of the Global Workplace Report 2025, Taiwan maintains the leading position within this group on the "Thriving" metric—a three-year rolling average for 2022–2024 that measures the share of individuals reporting current life evaluation scores of 7 or higher and future life evaluation scores of 8 or higher on a 0–10 scale. However, according to the World Happiness Report 2024, Taiwan ranks below Singapore in the share of respondents who report having freedom to make life choices in 2023. Consequently, Taiwan ranks below Singapore in Class 5b: Life Satisfaction.
For the combined indicator scores of self-expression and life satisfaction, Taiwan, Singapore, and Japan exhibit comparable levels, all of which are substantially higher than that of South Korea. However, in the combined domain of living conditions and democracy, South Korea ranks higher than the other three advanced Asian economies, as both Taiwan and Japan show weak performance in living conditions, while Singapore performs worst in democracy.
Key Reports
World Happiness Report (WHR) 2026
- Indicator: current life evaluation, annual scores in 2025
(See Figure 7.)
World Economic Forum, WEF: Global Gender Gap Index (GGI) 2025
- Indicator 1: Economic Participation and Opportunity subindex
- Indicator 2: Political Empowerment subindex
(See Figure 8.)
Freedom House: Freedom in the World 2026
- Indicator: Total scores for 2026
(See Figure 8.)
EIU: Democracy Index 2025
(See Figure 9.)
IMD: World Competitiveness Ranking 2026
(See Figure 9.)
Vision of Humanity: Global Peace Index 2026
- Indicator: Societal Safety and Security Subindex
(See Figure 10.)
Gallup: Global Safety Report 2026
- Indicator: Law and Order Index (scores for 2025)
(See Figure 10.)
Figure 7.
Figure 8.
- Figures for Hungary: 0.760, 65
- Figures for Singapore: 1.021, 48
- Taiwan's GGI data are sourced from its Department of Gender Equality.
Figure 9.
Figure 10.
- Late September
0 comments:
Post a Comment